
One World heritage site, different climates
The UNESCO World Heritage site West Norwegian Fjords encompasses the Nærøyfjord area in the county of Vestland and the Geirangerfjord area in Møre og Romsdal county.
Although both parts of the site share a strong maritime influence, their local climates differ substantially: while the Geirangerfjord region is comparatively wet (e.g., Tafjord, around 1,000 mm of precipitation per year), the inner fjord arms of the Nærøyfjord experience a noticeably drier, more sheltered microclimate (e.g., Lærdal, around 500 mm per year).
Based on a current overview presented by the Norwegian Climate Service Center, climate change is already measurable in both regions. Since 1970, average annual temperatures have increased by approximately 0.5 °C, and the duration of the winter snow cover has shortened by about three weeks in several areas.
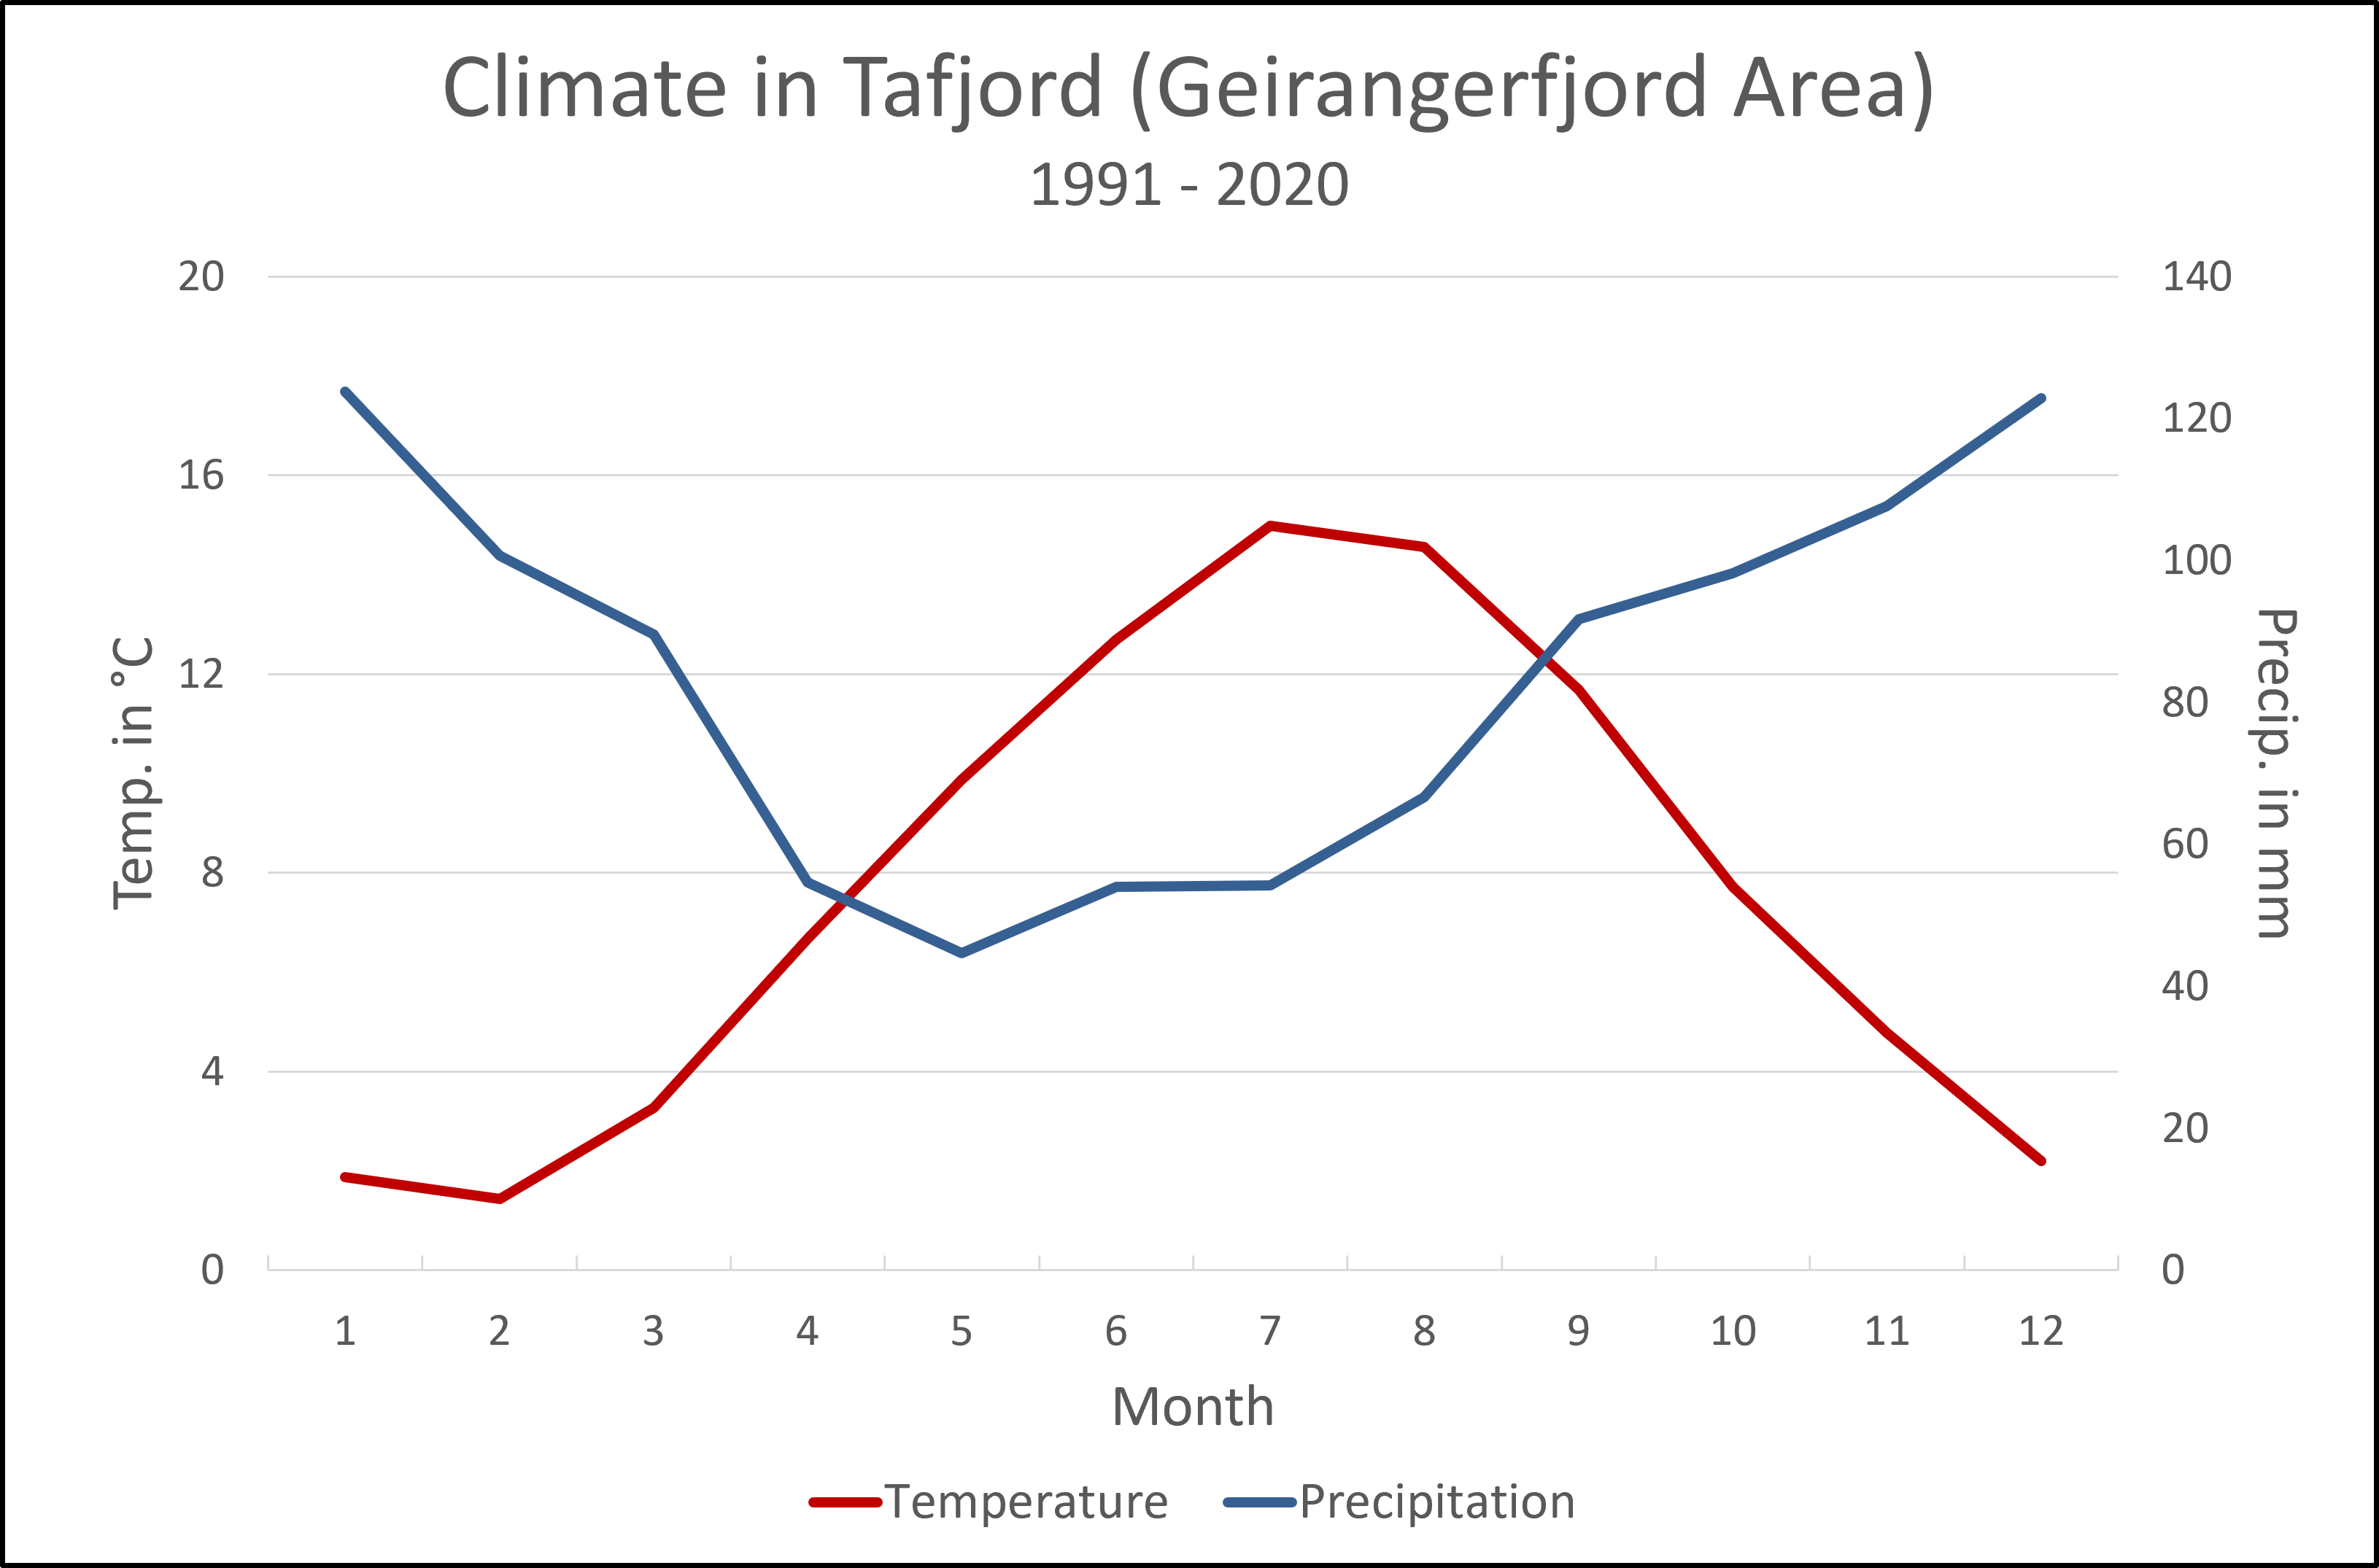
Climate diagram for Tafjord (Geirangerfjord region), 1991–2020. Average Temperature/Precipitation: 7,7°C / 1008 mm
Monthly mean temperatures (°C, red) and precipitation totals (mm, blue) illustrating the regional baseline climate in the Geirangerfjord area. Data Source: Seklima / Norwegian Meteorological Institute (met.no). Chart created by: Aaron Hager.
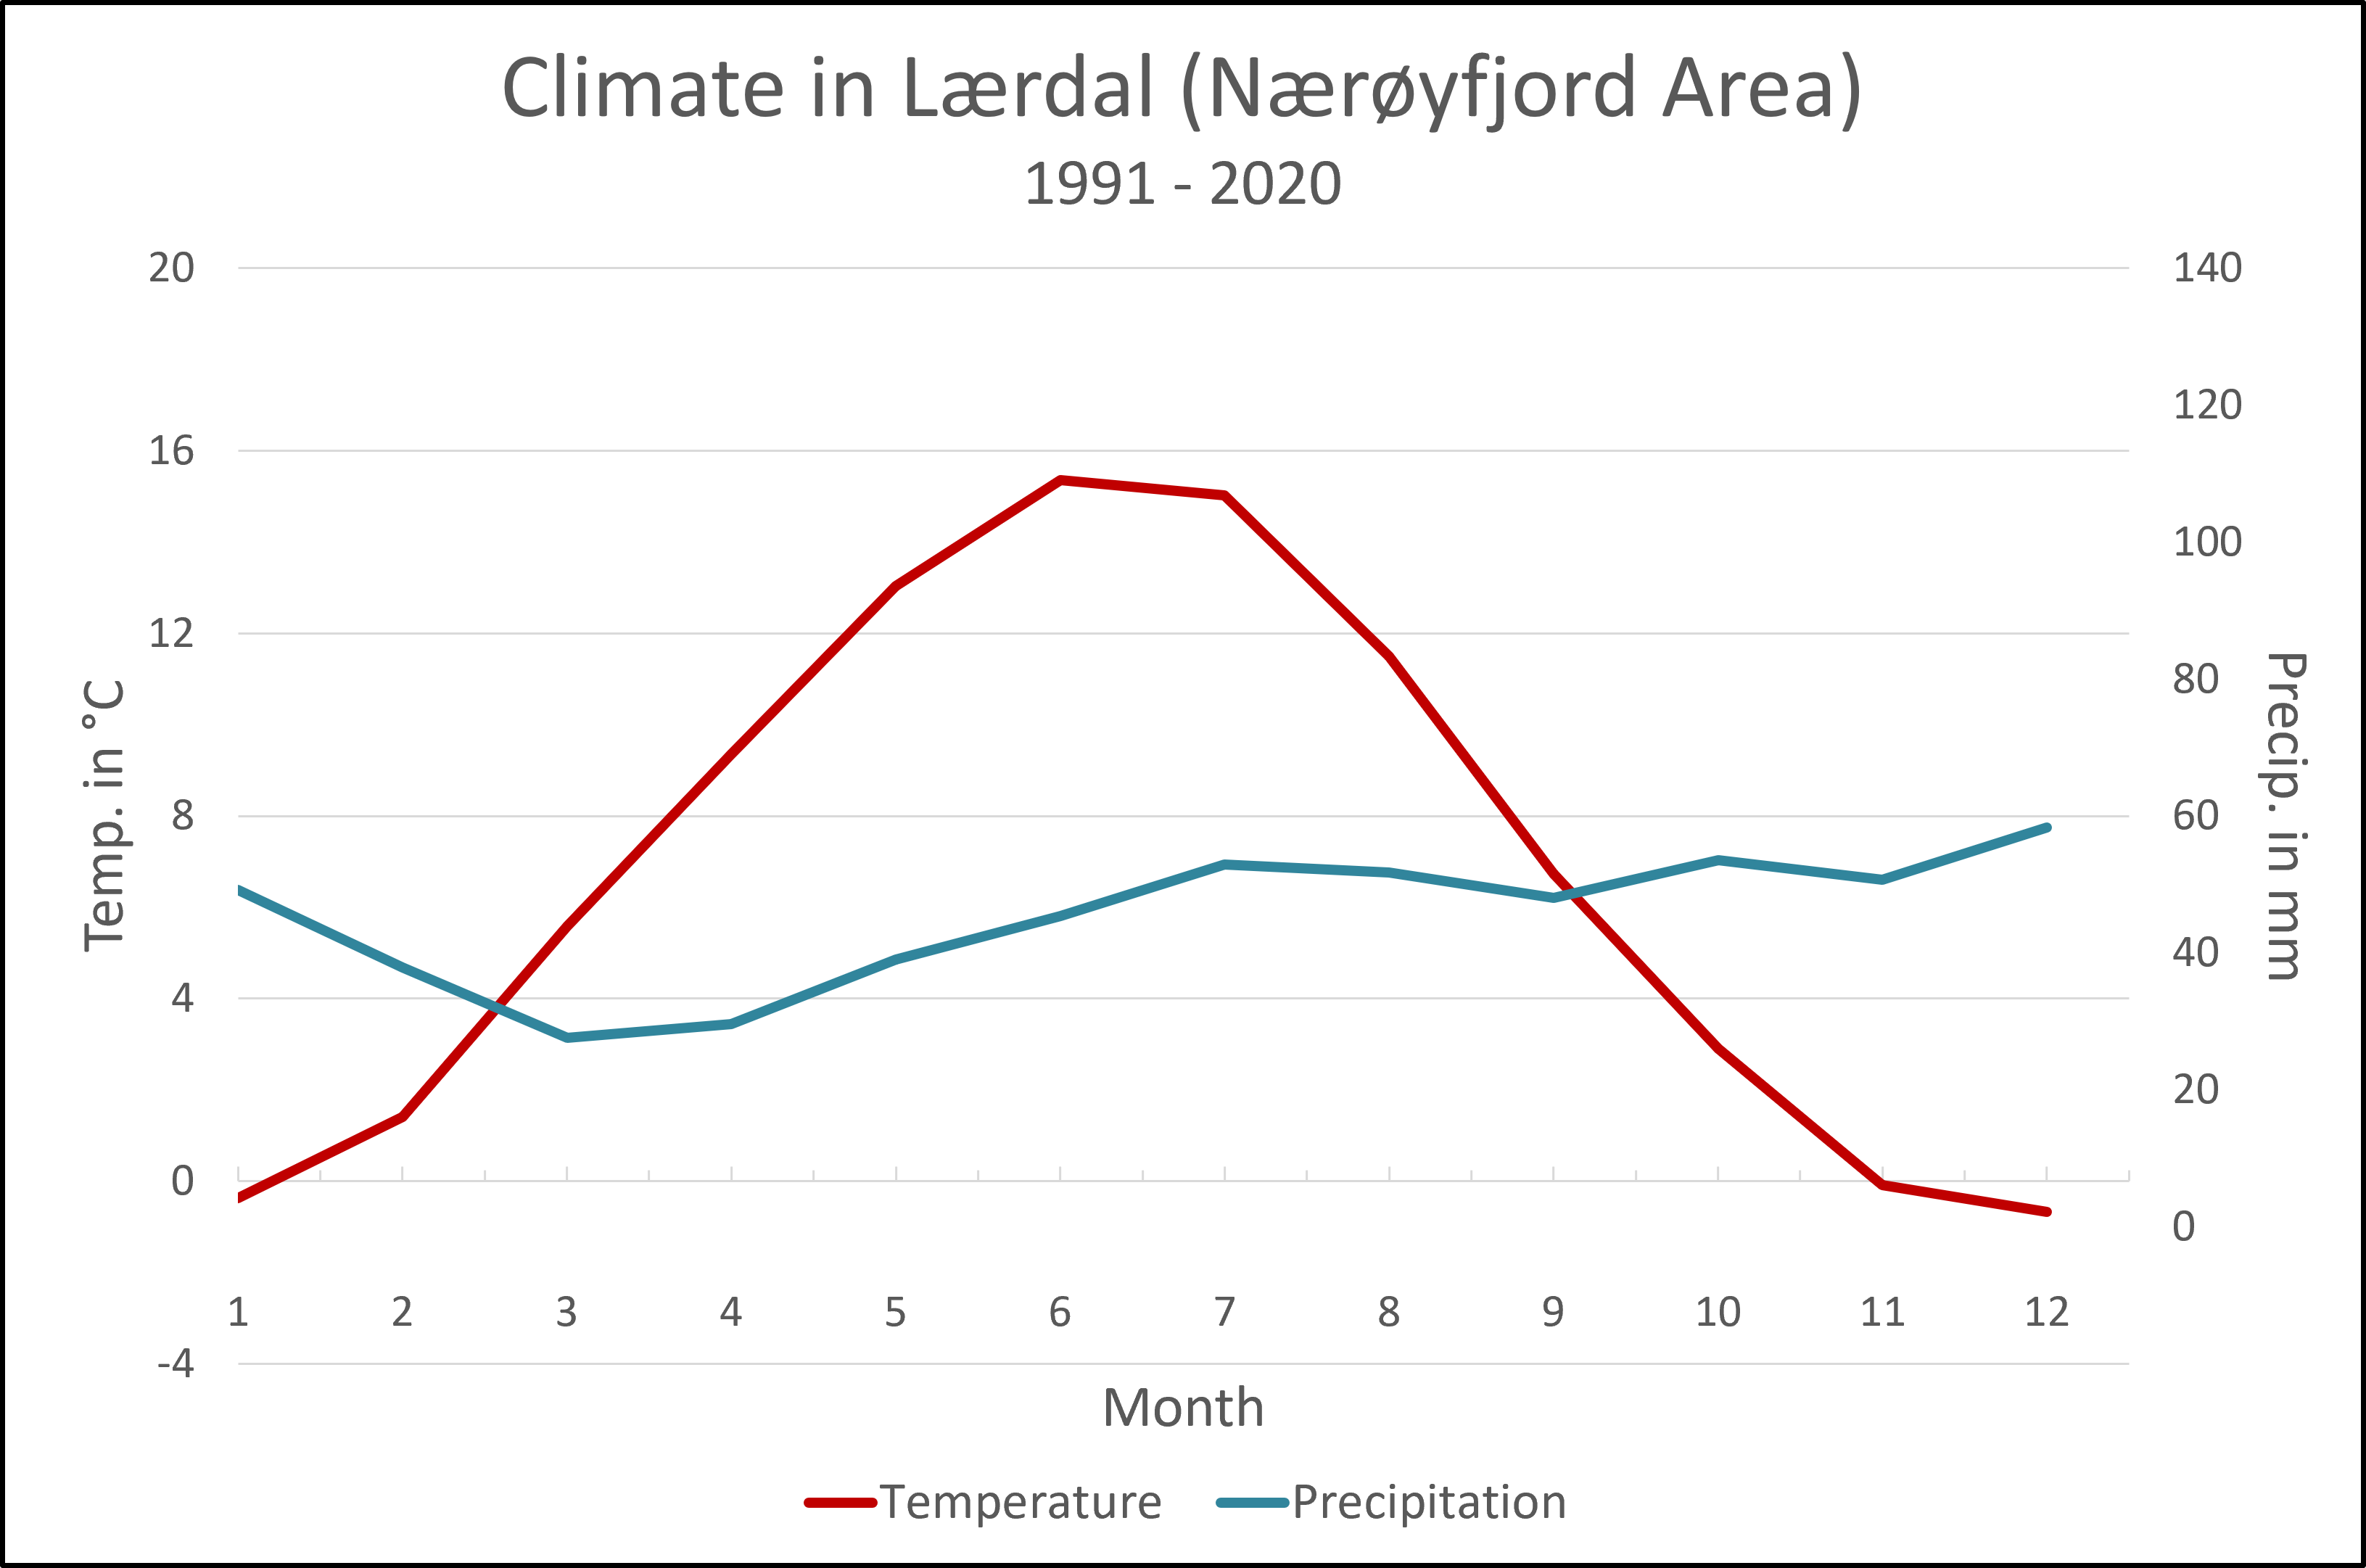
Climate diagram for Lærdal (Nærøyfjord region), 1991–2020. Average Temperature/Precipitation: 6,7 °C / 514 mm
Monthly mean temperatures (°C, red) and precipitation totals (mm, blue) highlighting the dry, sheltered microclimate of the inner Nærøyfjord area. Data source: Seklima / Norwegian Meteorological Institute (met.no) | Chart created by: Aaron Hager.
What Lies Ahead for the Fjords?
Regional modeling indicates clear trends for the future of the fjord landscape through the middle and end of this century. The projections below reflect model calculations under high greenhouse gas emissions (RCP8.5 / SSP3-7.0). (See below for explanation (Norwegian Climate Service Center.)
Norwegian regional climate profiles primarily focus on the high emission scenario. This does not necessarily imply that it is the most probable outcome. Rather, it serves as the foundation for the precautionary principle (Føre-var-prinsippet) enshrined in Norwegian building and environmental regulations. To protect infrastructure, bridges, roads, and World Heritage sites over the long term, planning must account for the maximum potential stress the region might face. Consequently, all subsequent projections and statements in this article are based on climate models calculated under the RCP8.5 scenario.
Temperature Rise and Shifting Seasons
Under the high emission scenario, average annual temperatures are expected to increase by approximately 2.0 °C in the West Norwegian fjords by mid-century (2031–2060) compared to the 1971–2000 reference period. By the end of the century, this warming could reach up to 3.0 °C. The numbers are based on prospects for the counties. These estimates are based on regional climate projections for the counties in which the World Heritage areas are located.
This warming is shifting seasonal rhythms noticeably: the growing season for plants will lengthen by one to three months, whereas the winter season will shrink by an average of six weeks. At the same time, hot summer days with average daily temperatures above 20 °C will increase by more than 20 days per year, particularly in the sheltered inner fjord valleys.
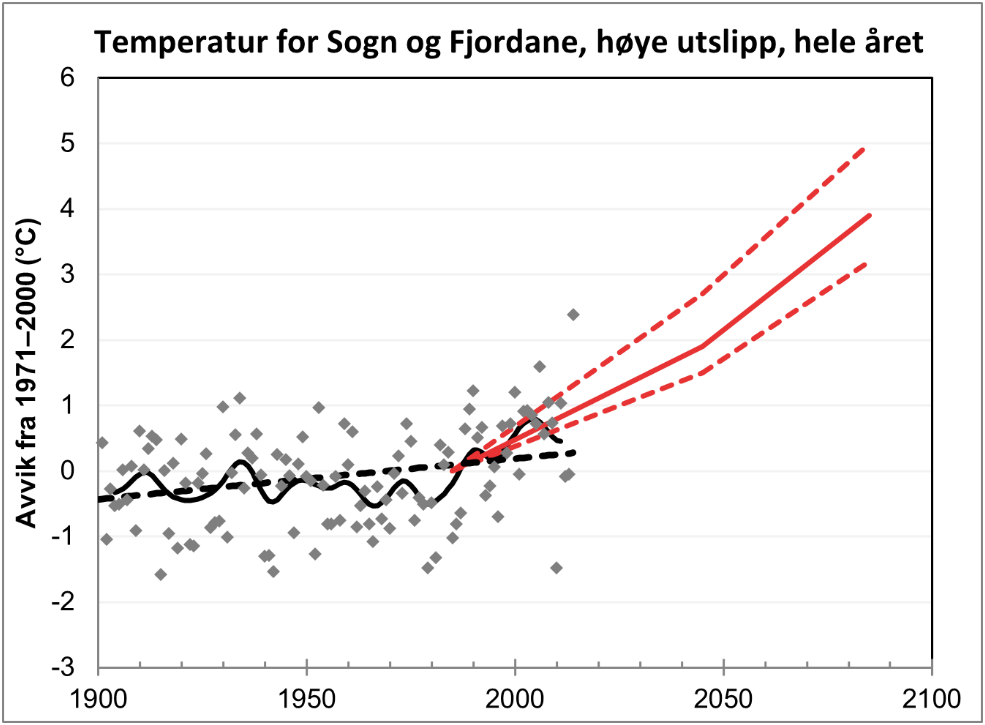
Temperature projections for Sogn og Fjordane (high emission scenario). Historical annual mean temperature anomalies relative to the 1971–2000 baseline (°C) alongside future projections up to 2100 under RCP8.5. The solid red line indicates the ensemble median, surrounded by the model range (dashed lines).
Source: NCCS / ArcGIS StoryMaps (Norwegian Climate Service Center).
Increased Rainfall and Intenser Downpours
Climate models also project a clear trend toward higher rainfall in the fjord region, with total annual precipitation expected to grow by 5% to 10%. However, the changing pattern of precipitation is even more significant than the total annual amount: heavy rain events will become noticeably more frequent and intense. Short, intense downpours lasting under three hours will grow particularly extreme, as a warmer atmosphere holds more moisture.
Intense downpours saturate the soils on steep slopes, increasing the risk of landslides and mudflows. To protect settlements and infrastructure from flash floods, local authorities are advised to add a climate allowance (Klimapåslag) of 40% when designing drainage and stormwater systems.
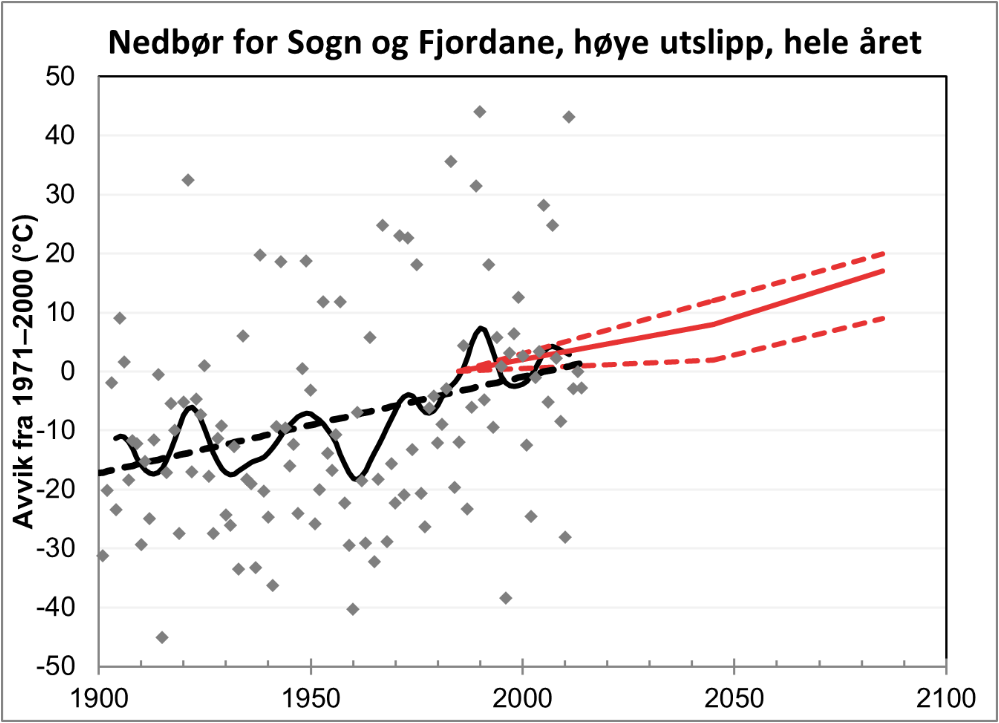
Annual precipitation projections for Sogn og Fjordane (high emission scenario). Historical precipitation anomalies relative to the 1971–2000 reference period (in %, mislabeled as °C in original source) alongside projected long-term increases up to 2100 under RCP8.5. The solid red line represents the ensemble median, bounded by the model range (dashed lines).
Source: NCCS / ArcGIS StoryMaps (Norwegian Climate Service Center).
Shrinking Snow and Ice, and Unstable Mountain Slopes
Rising temperatures are also transforming the high-altitude landscape and glaciers. In lowlands and coastal regions, the duration of seasonal snow cover will shorten by two to three months, accompanied by more frequent winter thaws and rain events. Glaciers are suffering a similar fate: between 2003 and 2019 alone, glacier area in Møre og Romsdal shrank by roughly 15%, a decline that continues unabated. In the high mountains, permafrost is thawing in many areas below 1,800 meters above sea level, weakening rock structures and increasing the risk of instability on steep fjord slopes.
The steep mountain walls, narrow valleys, and communities nestled along the water’s edge makes the fjord landscape vulnerable to climate impacts. While traditional dry-snow avalanches are decreasing in the lowlands, the threat of wet-snow avalanches in late winter is rising.
Although large spring snowmelt floods are generally declining, rainfall-driven summer and autumn floods will increase in smaller river basins. At the same time, rising sea levels are pushing storm surges deeper inland onto coastal land.
Climate change will also affect the cultural Heritage
Warmer, wetter conditions accelerate wood-decaying fungi. This poses a direct threat to the region’s historic timber architecture, including heritage farmsteads and boathouses.
Climate Adaptation (Klimatilpasning)
Because climate change can no longer be stopped by mitigation alone, the Norwegian Environment Agency (Miljødirektoratet) is actively preparing society and natural ecosystems for its impacts. This strategy is anchored in the precautionary principle: scientific data from the Norwegian Climate Service Center regarding historical patterns and future risks forms the basis for policy decisions. Using these insights, National Planning Guidelines (SPR) mandate that local municipalities incorporate climate risks directly into their spatial and developmental planning.
Adaptation is being implemented across multiple sectors: in construction, transport, and water infrastructure, efforts focus on landslide protection, rockfall mitigation, and managing heavy rainfall. In agriculture and nature management, preserving intact ecosystems serves as a natural shield against extreme weather. To ensure these measures can be executed locally, state grants are made available to municipalities and county authorities to fund concrete adaptation and protection projects.
Part of a broader pattern of Climate Changes
The climate changes observed in the West Norwegian Fjords are part of a broader pattern of human-induced climate change worldwide.
Since the onset of industrialization in the mid-19th century, Earth’s climate has undergone fundamental changes. The primary driver behind this transformation is anthropogenic (human-made) climate change: by burning fossil fuels such as coal, oil, and natural gas, as well as through global deforestation, humanity releases vast amounts of greenhouse gases, most notably carbon dioxide.
These gases accumulate in the atmosphere, acting much like the glass of a greenhouse: they allow shortwave solar radiation to pass through, but prevent the longwave heat radiation emitted by the Earth from fully escaping into space.
The historical trajectory of atmospheric concentration of CO2 illustrates this sharp increase. While pre-industrial levels remained stable at approximately 280 ppm (parts per million) over millennia, concentrations surpassed 420 ppm for the first time in 2023. As a result, the global average temperature has already risen by 1.2 °C to 1.3 °C above pre-industrial levels.
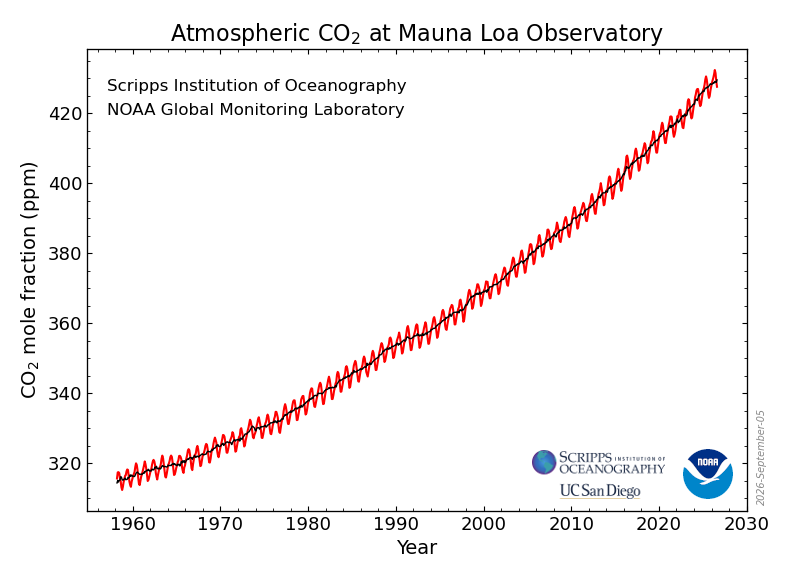
Atmospheric CO2 concentration since 1958. The Keeling Curve recorded at Mauna Loa Observatory, Hawaii, shows the continuous rise in atmospheric carbon dioxide in parts per million (ppm). The red line represents seasonal fluctuations (driven by vegetation cycles), while the black line shows the seasonally adjusted long-term trend.
Source: NOAA Global Monitoring Laboratory / Scripps Institution of Oceanography (UC San Diego).
Climate Scenarios Explained
To understand how the climate might evolve over the coming decades, scientists rely on computer modeling based on different future scenarios for global greenhouse gas emissions. In the reports of the Intergovernmental Panel on Climate Change (IPCC) and the Norwegian Climate Service Center (Norsk Klimaservicesenter), two main frameworks are commonly referenced: RCPs (Representative Concentration Pathways) from the IPCC 5th Assessment Report, and the newer SSPs (Shared Socioeconomic Pathways) from the 6th Assessment Report.
Scenario Type | Low Scenario (Climate Mitigation) | Medium Scenario (Moderate Development) | High Scenario (Worst-Case / Precautionary Principle) |
IPCC AR5 (RCP) | RCP2.6: Rapid emission reductions; global warming kept below 2 °C. | RCP4.5: Emissions peak around 2040 and decline slightly thereafter. | RCP8.5: Unchecked, continuous emission growth. |
IPCC AR6 (SSP) | SSP1-2.6: Sustainable path with a rapid global energy transition. | SSP2-4.5: Middle of the road with delayed transition. | SSP3-7.0 / SSP5-8.5: High global emissions; emissions double by 2100. |
Overview of IPCC climate scenarios (AR5 & AR6). Key parameters of RCP and SSP emission pathways used for global and regional climate projections. Source: IPCC
References
IPCC. (2013). Climate Change 2013: The Physical Science Basis. Contribution of Working Group I to the Fifth Assessment Report (AR5) [Stocker, T.F., et al. (eds.)]. Cambridge University Press.
IPCC. (2021). Climate Change 2021: The Physical Science Basis. Contribution of Working Group I to the Sixth Assessment Report (AR6) [Masson-Delmotte, V., et al. (eds.)]. Cambridge University Press.
Kommunal- og distriktsdepartementet. Statlige planretningslinjer for klima- og energiplanlegging og klimatilpasning (SPR). Norwegian Ministry of Local Government and Regional Development.
Miljødirektoratet. Klimatilpasning i Norge (National guidance, precautionary principles, and funding frameworks for climate adaptation). Norwegian Environment Agency. Available at: miljodirektoratet.no.
NOAA Global Monitoring Laboratory & Scripps Institution of Oceanography. Atmospheric CO₂ Trends at Mauna Loa Observatory, Hawaii. UC San Diego / NOAA GML. Available at: gml.noaa.gov/ccgg/trends.
Norsk Klimaservicesenter (NCCS). (2015/2021). Klimaprofil Vestland and Klimaprofil Møre og Romsdal. NCCS Report Series. Norwegian Meteorological Institute (MET Norway). Available at: seklima.met.no.
Norsk Klimaservicesenter (NCCS). Klimatilpasning i Norsk Verdensarv: Vestnorsk Fjordlandskap. Interactive GIS-based Climate StoryMap. Available at: ArcGIS StoryMaps.
UNESCO World Heritage Centre. West Norwegian Fjords – Geirangerfjord and Nærøyfjord (Inscribed 2005). Heritage documentation and vulnerability reports. Available at: whc.unesco.org/en/list/1195.
Written by Aaron Hager